RESEARCH DESK
Give your teams the context to decide — and explain why.
Less time assembling research. More time applying judgement.
Bring price, positioning and news into one workspace. Inspect the evidence beside the interpretation, so your team can explain a market move without piecing the context together across separate screens.
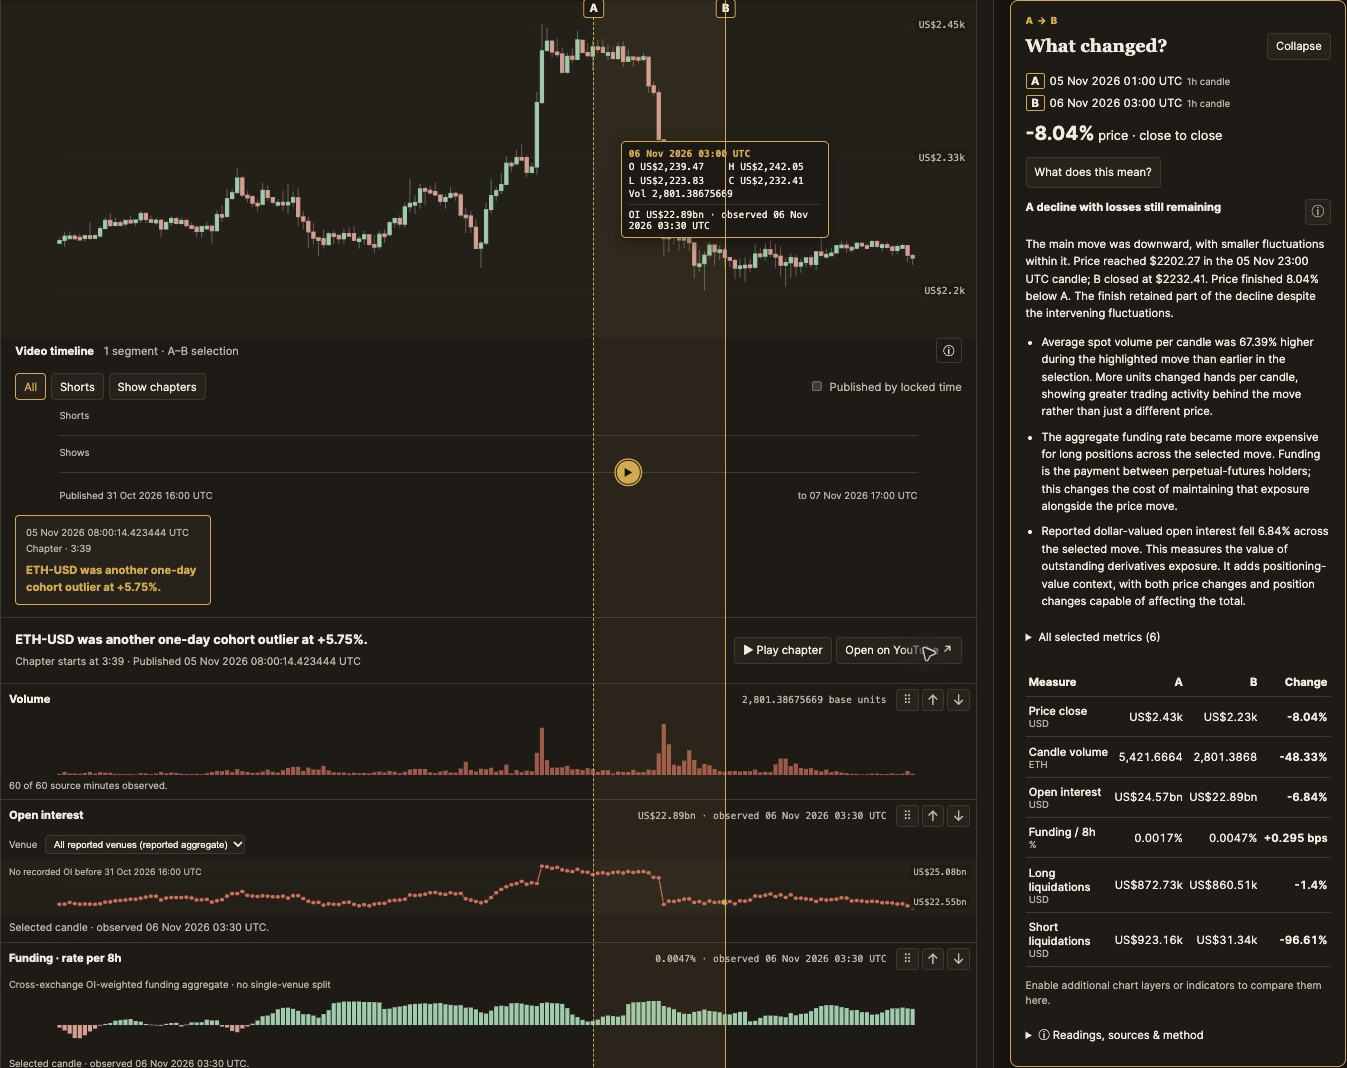
REAL RESEARCH DESK ANALYSIS · ETH-USD · 5–6 NOV 2026
−8.04%price, close to close
+67.39%average spot volume per candle
−6.84%reported open interest
A falling price, greater trading activity and lower reported open interest: the move and its context, with the underlying readings ready to inspect.
Historical example: completed 1h candles, 5 Nov 01:00 → 6 Nov 03:00 UTC. Recorded relationships provide context; they do not establish causation.246instruments7 NOV 2026
67categories7 NOV 2026
12capabilitiesDEMONSTRATED
12 institutional capabilities.
Every capability below is shown in a real Research Desk capture taken on 7 November 2026. Some screens show earlier selected dates. The ZEC example on the home page is the Daily briefings capability.
{{ feat.eyebrow }}
{{ feat.title }}
{{ feat.desc }}
{{ feat.clock }}
{{ m.label }}
Open full size ↗
Searchable library · Bollinger Bands, SMA 50 and RSI 14 selected
Open full size ↗
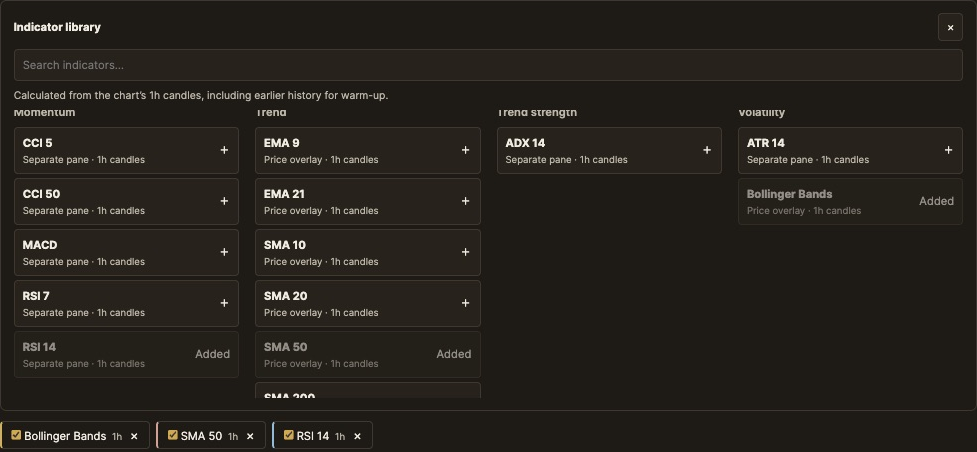
Historical product evidence. Signal Book ranks are research ordering, not recommendations.